A pivot table allows you to generate a summary of the data in your spreadsheet. It also makes it easier to analyze or compare large chunks of data with a few clicks of a button. In Google Spreadsheets, creating a pivot table is a simple task.
If you’re using a spreadsheet for a budget, for example, you can create a pivot chart to quickly see how much you’re spending on each category of your expenses.
Pivot tables are, of course, much more powerful tools. Learning the basics of how to create a pivot table can allow you to experiment and do far more complex calculations with the spreadsheet feature.
How to Create a Pivot Table in Google Sheets
Using the example of a spreadsheet budget, we’re going to walk through the steps to create a pivot table in Google Sheets. Before you begin, make sure that each column with data has a column header in order for this to work.
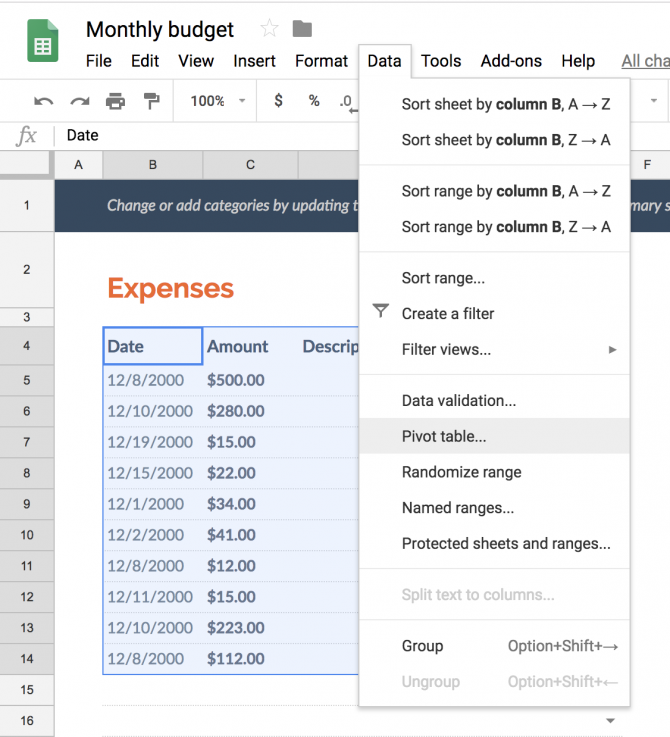
Select the cells you want to use to generate the table unless you want to use the entire table.
In the Google Sheets menu, click Data > Pivot table.

This will create a new sheet in your spreadsheet. In the Pivot table editor, you can select which criteria you want to appear.

(Google Sheets may also make some recommended Pivot tables for you to generate with the click of a button.)
For Rows, click Add and select the data you want to calculate. In a budget spreadsheet, this would be the Category Expense. In this example, we’re using the Google Spreadsheet monthly budget template.

For Columns, if there are certain criteria that allows you to drill down about the data in your Rows, you can add it here. In a budget, for example, you might want to see the type of expenses summarized, but spread out across the dates the transactions took place.
For values, you can select to calculate the numbers of instances based on your rows, so simply select the same Row you added in the first step. In the case of the budget, you’ll want to select the Amount.

Once you’ve created your Pivot Table, it will be viewable at any time in that sheet, and as you add more data to your spreadsheet, the Pivot Table will also change dynamically as long as the cells you’re updating are in the original selection you made when creating the table.

To find out about more in-depth ways in which you can use pivot tables, and to find out how to create them in Microsoft Excel, take a look at How to Use an Excel Pivot Table for Data Analysis.
Read the full article: How to Create Pivot Tables in Google Sheets


